Custom Accounting & CFO Advisory | Saskatchewan

Business Plan Services for Hospitality Industry Canada | Custom CPA
🍽️ Hospitality Business Planning — Canada 2026

Business Plan Services for the
Hospitality Industry Canada

📌 Quick Summary

The Canadian hospitality industry — restaurants, hotels, bars, catering companies, food trucks, and event venues — is one of the most capital-intensive and operationally complex sectors in which to build a business. A CPA-prepared hospitality business plan is the tool that secures CSBFP financing, liquor board approvals, commercial leases, and investor confidence by demonstrating that the concept is financially viable through rigorous food cost modeling, labour cost analysis, RevPAR projections, and realistic cash flow forecasting. This guide covers the complete business plan framework for every type of Canadian hospitality business in 2026.

1. Hospitality Business Types & Their Business Plan Requirements

Canada’s hospitality sector spans enormously diverse business models — each with its own financial structure, regulatory requirements, and business plan focus:

🍽️
Restaurant (Full-Service / Casual Dining)
  • Prime cost (food + labour): target <60% of revenue
  • Business plan focus: food cost, covers per night, AOV
  • Liquor license: significant revenue & compliance element
  • CSBFP for kitchen equipment + leasehold improvements
  • Break-even covers per day/week is key metric
🏞
Hotel / Motel / Inn
  • RevPAR (Revenue per Available Room) is the primary KPI
  • ADR and occupancy rate model by season
  • CMHC insured financing for qualifying properties
  • F&B, events, parking: ancillary revenue streams
  • Property management system and OTA commission model
🍻
Bar / Nightclub / Pub
  • Liquor license: AGCO, LCLB, AGLC requirements
  • Beverage cost (pour cost): target 18–25%
  • Entertainment license; sound compliance costs
  • Late-night operating model vs. daytime traffic
  • Security, ID verification compliance budgeted
🍸
Catering Company
  • Event-based revenue; advance deposits model
  • Lower fixed costs vs. brick-and-mortar food service
  • Food cost per head calculation for each event type
  • Seasonal cash flow (wedding season peak)
  • Commercial kitchen lease; delivery vehicle CapEx
🍔
Food Truck / Pop-Up
  • Lower startup cost; mobile; event-based revenue
  • Business plan: commissary kitchen + municipal permits
  • Weather and seasonality revenue risk modeling
  • Festival and catering contract revenue diversification
  • Truck CapEx and commissary kitchen agreement
🍿
Event Venue / Banquet Hall
  • Per-event revenue; deposit & deferred revenue management
  • Minimum-spend contracts; F&B revenue + venue fee
  • Seasonal bookings (weddings peak May–October)
  • Occupancy rate and revenue per event model
  • Liquor service license; catering kitchen requirements

First-time hospitality business owners should read our First-Time Business Owner Tax Compliance guide. Saskatchewan hospitality businesses registering should see our Business Name Registration guide. For maximizing hospitality business expense deductions, our Documenting Business Expenses guide is essential. Tourism-linked hospitality businesses should see our Tourism Business Plan guide and our Tourism Bookkeeping guide. E-commerce food and beverage businesses should review our E-Commerce Tax Planning guide. For 2027 tax changes affecting hospitality corporate structures, see our Tax Changes 2027 guide. Hospitality pharmaceutical/cannabis operators should see our Pharmaceutical Bookkeeping guide. And hospitality businesses implementing POS/ERP integration should review our ERP Consulting guide.

🍽️
60%
Prime Cost Maximum — food cost + labour cost must stay below 60% of revenue for most Canadian restaurants to generate sustainable EBITDA after occupancy and overhead
💰
CSBFP
Canada Small Business Financing Program — government-backed loans covering up to $1M each for equipment and leasehold improvements; the primary hospitality startup financing tool
🏞
RevPAR
Revenue per Available Room — the primary hotel performance metric (ADR × Occupancy %); the business plan must project RevPAR and benchmark against the competitive set
⚠️
Working Capital
The most common reason hospitality businesses fail is insufficient working capital at launch — not a bad concept; the business plan must model 3–6 months of cash reserves

🍽️ Launching or Expanding a Canadian Hospitality Business? A CPA-Prepared Business Plan Is Your Key to CSBFP Financing and Investor Confidence.

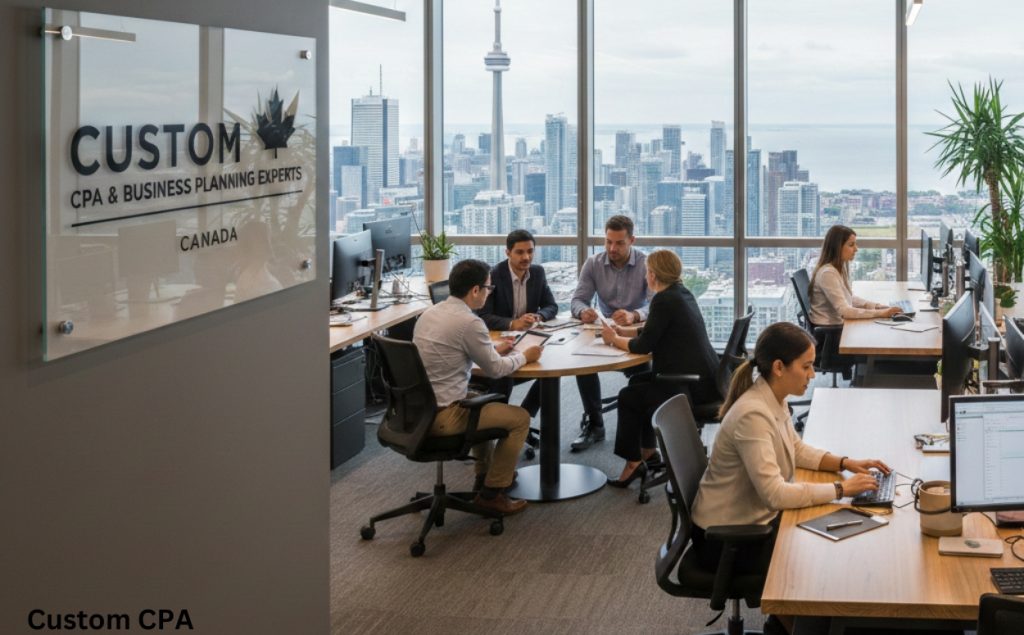
Custom CPA prepares hospitality business plans with credible food cost models, hotel RevPAR projections, labour cost analysis, startup cost schedules, and lender-ready financial packages built to secure Canadian hospitality financing.

2. Hospitality Business Plan Structure — Complete Section Guide

📋 Canadian Hospitality Business Plan — Complete Section Structure
01
Executive Summary
Hospitality concept description; location address or target area; target customer; unique selling proposition; funding request (amount, purpose, CSBFP eligibility); 3-year revenue and EBITDA summary; management team credentials. The executive summary must convey the concept’s financial viability in 2 pages. For a restaurant: Year 3 revenue projection, food cost %, labour cost %, and EBITDA % are the key numbers banks review first.
02
Concept & Offering Description
Restaurant: cuisine style, menu concept, price point, ambiance, seating capacity, hours; Hotel: property type, room count, amenities, brand (flag vs. independent); Bar: concept theme, entertainment format, target demographic; Catering: event types served, cuisine style, minimum spend. Include sample menu or room type descriptions. The concept must be differentiated — lenders and landlords see hundreds of generic restaurant plans. What specifically makes this concept work in this location for this customer?
03
Market & Location Analysis
Trade area demographics (population, household income, age); pedestrian and vehicle traffic counts; competitive landscape (named competitors, their price point, estimated weekly covers/occupancy, their weaknesses); tourism patterns if relevant; market trends supporting the opportunity; hotel: STR data or comparable RevPAR for the competitive set. Location analysis for restaurants and bars: the location is typically the primary determinant of success — a mediocre restaurant in an exceptional location outperforms an exceptional restaurant in a mediocre location.
04
Financial Plan (CPA-Prepared — Most Critical)
Startup cost schedule; revenue model (covers per service × AOV for restaurants; ADR × occupancy for hotels; events per month for venues); food/beverage cost model; labour cost model by position; operating expense model; 36-month income statement; monthly cash flow; break-even analysis; working capital requirements; GST/HST registration and remittance model; corporate tax projection; sensitivity analysis (what happens if food costs increase 5% or covers are 20% below projection?). The financial model is the section that banks scrutinize most — unrealistic food cost or labour assumptions are the most common reason hospitality business plans are declined.
05
Operations Plan
Kitchen layout and equipment list; staffing plan by position (FOH and BOH for restaurants); supplier relationships and ordering frequency; food safety (HACCP, Food Handler certifications); POS system; delivery and takeout strategy; reservation management; hotel: housekeeping, front desk, maintenance staffing; property management system (PMS); OTA (Booking.com, Expedia) strategy and commission model. The operations plan demonstrates to lenders and investors that the management team has thought through the day-to-day operational requirements — not just the concept.
06
Management Team & Credentials
The hospitality business plan must document the management team’s qualifications: relevant industry experience (years in restaurant/hotel management); specific roles and responsibilities; culinary credentials (Red Seal, culinary school); business qualifications; relevant previous successes. The management team section answers the lender’s most important question: “Can this team actually execute?” A compelling concept with an inexperienced management team is the highest-risk hospitality investment. A solid concept with proven operators is fundable. If experience is limited, identify an experienced general manager as a key hire.

3. Restaurant Financial Model — Food & Labour Cost Framework

Restaurant Revenue Distribution — Target % of Revenue (Casual Dining, $1.2M Annual Revenue Example)
Food Cost
Target: 28–32% for most casual dining; above 35% = pricing or purchasing problem; below 25% = potential quality concern
30% ($360K)
Labour Cost (FOH + BOH)
Target: 28–35%; highest single cost; includes all wages, CPP, EI, benefits; fine dining: 35–45%; QSR: 22–28%
32% ($384K)
Occupancy (rent + CAM)
Target: 6–10% of revenue; above 12% = rent is too high for the revenue; negotiate rent as % of sales for new concepts
8% ($96K)
Marketing & Technology
Google/Meta ads, social media, POS, reservation system, delivery platform commissions; 3–5% target
4% ($48K)
Utilities & Operating
Gas, hydro, water, linen, cleaning, pest control, maintenance; 4–6% for typical restaurants
5% ($60K)
EBITDA
Residual after all operating costs; target 10–18% for casual dining; below 8% = high risk; below 0% = unsustainable
15% ($180K)
Other G&A + Insurance
Insurance (commercial, liquor liability), accounting/legal, admin, uniforms, smallwares replacement: 5–7%
6% ($72K)
💡
The Prime Cost Rule — The Most Important Restaurant Financial Benchmark: Prime Cost = Food Cost % + Labour Cost %. For the example above: 30% + 32% = 62% Prime Cost. Most hospitality financial experts use 60–65% as the maximum sustainable prime cost. If prime cost exceeds 65%, the remaining 35% must cover rent (6–10%), utilities (4–6%), marketing (3–5%), insurance and G&A (5–7%), and still generate EBITDA — which mathematically becomes impossible. A restaurant business plan must demonstrate that the specific menu, pricing, and staffing model produces a prime cost at or below the target. Generic industry averages are not acceptable — the CPA builds the model from your actual menu prices, supplier quotes, and staffing plan. Our Business Planning & Financial Modeling service builds detailed restaurant financial models for Canadian lenders and investors.

4. Hotel Business Plan — RevPAR & GOPPAR Financial Model

📋 Hotel Financial Model — Key Metrics the Business Plan Must Project
ADR (Average Daily Rate) — the pricing metric — ADR = Total Room Revenue ÷ Occupied Rooms. The business plan projects ADR based on: competitive set pricing (STR market data or manual competitive survey of comparable hotels in the market); seasonal variation (higher ADR in peak tourist or business travel seasons; lower in shoulder months); room type mix (standard rooms at lower ADR; suites at premium ADR). Example: a 40-room mid-scale hotel in Saskatoon models ADR at $145 (off-peak), $175 (shoulder), $210 (peak summer) with a blended annual ADR of $165. ADR must be benchmarked against the competitive set — projecting ADR above market without a specific competitive justification is a common business plan error. Benchmark to Comp Set
Occupancy Rate — the demand metric — Occupancy % = Occupied Rooms ÷ Available Rooms × 100. The business plan projects occupancy based on: market demand generators (corporate accounts, leisure tourism, group events, highway traffic); competitive set occupancy (STR data); ramp-up period (new hotels typically take 12–24 months to reach stabilized occupancy). A new hotel should NOT project stabilized occupancy in Month 1. A realistic ramp: Month 1–3: 35–45% occupancy; Month 6: 55–65%; Month 12–18: stabilized at target occupancy (65–75% for most mid-scale Canadian hotels). Model Ramp-Up
RevPAR (Revenue per Available Room) — the combined performance metric — RevPAR = ADR × Occupancy %. Example: $165 ADR × 70% occupancy = $115.50 RevPAR. For a 40-room hotel: annual rooms revenue = $115.50 × 40 rooms × 365 days = $1,686,300. RevPAR is the single most important hotel performance metric and the primary basis for hotel valuation (Cap Rate = NOI ÷ Value). A lender or investor evaluating the business plan will benchmark projected RevPAR against the current market RevPAR for comparable hotels from STR data. Projecting RevPAR above market requires specific justification (superior location, unique amenity, captured demand not served by existing supply). Primary KPI
GOPPAR (Gross Operating Profit per Available Room) — the profitability metric — GOPPAR = Total Gross Operating Profit ÷ Available Rooms ÷ Days. Gross Operating Profit = Total Revenue – Operating Costs (excluding property taxes, insurance, debt service, management fees, and FF&E reserves). GOPPAR benchmarks by hotel type: budget/economy: $20–$40/room/day; mid-scale: $35–$65/room/day; upscale: $60–$120/room/day. Below-benchmark GOPPAR signals operational inefficiency or below-market RevPAR. The business plan must project GOPPAR by department: rooms department profit margin (typically 70–80%); F&B margin (25–40%); other revenues. By Department

5. Startup Cost Analysis by Hospitality Business Type

Business TypeTypical Startup Range (Canada 2026)Key Cost DriversCSBFP Eligible Portion
QSR / Fast Casual (leased space)$100,000–$350,000Kitchen equipment, counters, signage, POS, initial inventory, health permits, trainingEquipment + leasehold: up to $200,000 CSBFP; lower for simple builds
Casual Dining Restaurant (raw space)$350,000–$750,000Full kitchen build-out (HVAC, gas, electrical, plumbing); front-of-house fit-up; furniture; bar construction; liquor licenseEquipment: up to $500,000 CSBFP; leasehold up to $500,000; combined max $1M equipment + $1M leasehold
Fine Dining Restaurant$600,000–$2,000,000+Premium kitchen; custom millwork and design; wine cellar; high-end dinnerware; marquee location premium rent deposit; chef recruitmentCSBFP covers eligible equipment and leasehold; personal equity and investor capital for design premium
Bar / Pub / Nightclub$200,000–$800,000Bar construction; draft system; commercial sound + lighting; security system; liquor license premium (up to $50,000+ in ON/BC); HVAC for dance floorEquipment and leasehold eligible for CSBFP; liquor license not CSBFP-eligible — requires personal equity
Food Truck$75,000–$200,000Custom truck ($60,000–$150,000 for a fully equipped commercial kitchen on wheels); commissary kitchen access agreement; municipal permits; wrap/brandingTruck = eligible equipment for CSBFP; commissary fit-out if leasehold improvement
Catering Company$50,000–$250,000Commercial kitchen lease + fit-up; catering equipment; vehicles; uniforms; website; initial working capital for staffing depositsKitchen equipment and leasehold improvements CSBFP-eligible; vehicles eligible
Hotel / Motel (new build)$80,000–$200,000+ per roomLand (often not financed by lenders); construction; FF&E (furniture, fixtures, equipment); PMS, key systems; pre-opening costs; working capital reserveCSBFP covers eligible equipment up to $1M; conventional commercial mortgage for construction; CMHC insured for qualifying rental accommodations

6. Market & Location Analysis for Hospitality Business Plans

📋 Hospitality Market Analysis — What Lenders and Investors Require
Trade area demographics — the customer foundation — define the trade area (typically 1–3 km radius for urban restaurants; broader for destination dining or hotels); obtain population, household income, age distribution, and household composition data from Statistics Canada or municipal planning documents. Target customer profile: for a casual dining restaurant targeting families — households with children, median income $75,000–$120,000, within 5 km. This demographic data validates that the target customer exists in sufficient numbers in the trade area to support the projected revenue. Statistics Canada Data
Traffic count and visibility analysis — critical for restaurants and bars — for street-level or strip-mall hospitality businesses: obtain municipal traffic count data for the specific intersection (most municipalities publish traffic counts for major intersections); assess pedestrian foot traffic (downtown: morning, lunch, evening counts); evaluate visibility from the road (signage visibility, parking ease, entrance accessibility). A restaurant at a high-traffic intersection with excellent signage can achieve 20–40% higher revenue than an identical concept with poor visibility — making location analysis one of the highest-ROI elements of the business plan. Location = Revenue
Competitive landscape analysis — specific named competitors with data — identify the 4–8 direct competitors in the trade area: restaurant type; approximate seating capacity; estimated weekly covers; price point (average check); Yelp/Google ratings and review themes (what are they doing well? What complaints do customers have?); years in operation (stability indicator). For hotels: competitive set using STR data (aggregated occupancy and ADR for the comp set). The competitive analysis must identify what specific weakness in the existing competition your concept exploits — a market gap that your business fills. Named Competitors
Lease terms analysis — the most important single document in a restaurant business plan — the restaurant lease is the most critical business document after the business plan itself. Key lease terms that must be in the business plan: rent per square foot (and as a % of projected Year 1 and Year 3 revenue); lease term (minimum 5 years with renewal options for restaurant financing); leasehold improvement allowance (landlord contribution to the build-out); exclusivity clause (prevents the landlord from leasing to a directly competing concept in the same property); assignment rights (can the lease be assigned in a business sale?); personal guarantee requirements. A lender will not advance CSBFP funds for leasehold improvements unless the lease term plus renewal options exceeds the loan amortization period. Lease Review Critical

7. GST/HST, Liquor Tax & Corporate Structure for Canadian Hospitality

Tax ConsiderationHospitality ImpactBusiness Plan Integration
GST/HST on food and beverageRestaurant meals in Canada: taxable at provincial rate (Ontario 13% HST; Alberta 5% GST). Basic groceries: zero-rated. Prepared food under $4 at a food establishment: complex rules; confirm with CPARevenue projections must separate food and beverage revenue by category; GST/HST collected is a liability — cash flow model must reflect quarterly remittances; ITC claims on all inputs reduce net payable
GST/HST on hotel accommodationHotel room charges: taxable at applicable provincial rate; Provincial Tourism Levies (Municipal Accommodation Tax) in many Ontario, BC, and Alberta cities: additional 2–4% on room revenueModel HST separately from room revenue; provincial tourism levy (MRDT/MAT) is collected from guests and remitted to the municipality; each levy has a separate remittance process — budget for compliance administration
Liquor tax and markupLiquor purchased through provincial liquor boards (LCBO, AGLC, BCLDB, SLGA) includes government markup before the restaurant/bar purchases it; no additional GST on the markup portion in some provincesBeverage cost model must use actual LCBO/BCLDB/AGLC prices (not US or international prices); pour cost analysis built from actual spirit, wine, and draft costs available in the specific province
Corporation vs. sole proprietorshipIncorporated restaurant/hotel: corporate tax on first $500K active income at ~12% (small business rate); allows income splitting; liability protection. Sole prop: all income at personal marginal rate (50%+)Business plan recommends incorporation for most hospitality businesses where net income is expected to exceed $75,000–$100,000; incorporation cost and annual maintenance built into the startup cost schedule
Tip reporting and T4A complianceRestaurant employers must track tips; controlled tips paid through the POS = employment income; direct tips to servers may or may not be employment income depending on circumstancesPayroll model must account for tip reporting obligations; employer CPP/EI implications on controlled tips; CRA’s restaurant industry audit program focuses on unreported tip income

8. Financing Options for Canadian Hospitality Businesses

📋 Hospitality Financing — What the Business Plan Must Support
Canada Small Business Financing Program (CSBFP) — the primary tool — CSBFP is the most widely used financing tool for Canadian restaurant and hospitality startups. It allows chartered banks to lend with a federal government guarantee of 85% of the loan balance. For hospitality: Equipment loans: up to $1,000,000; covers kitchen equipment, refrigeration, POS, bar equipment, hotel FF&E. Leasehold improvement loans: up to $1,000,000; covers restaurant build-out, kitchen plumbing and electrical, bar construction, signage, accessibility improvements. Working capital (since 2022): up to $500,000; covers first-year operating costs, inventory, and cash flow. Total maximum CSBFP per borrower: $1.5M. Interest rate: maximum prime + 3%. A hospitality business plan designed for CSBFP must: present a management team with relevant experience; demonstrate financial projections that show the business can service the loan; and include a personal guarantee from the owner(s). Primary Source
BDC (Business Development Bank of Canada) — tourism and hospitality specialist — BDC specifically supports Canadian tourism and hospitality businesses and often provides financing to operators that conventional banks decline. BDC products for hospitality: start-up financing; working capital loans; equipment financing; seasonal business financing (advance working capital before peak season, repay during/after peak season). BDC’s tourism advisory services can also provide consulting support alongside financing. A BDC loan application requires a business plan demonstrating financial viability and management capability. BDC is more flexible on time-in-business and collateral requirements than chartered banks. Tourism-Friendly
Franchise financing — banks favor established brands — Canadian banks (RBC, TD, BMO, Scotiabank, CIBC) have specialized franchise lending programs that recognize the reduced failure rate of established franchise systems. For franchise hospitality concepts: the bank may waive the requirement for prior restaurant experience if the franchisor provides comprehensive training; the bank lends based on the franchise system’s financial performance data rather than solely on projections; loan-to-value ratios may be more favorable. The business plan for a franchise restaurant must include: the Franchise Disclosure Document (FDD) or equivalent; the franchisor’s financial performance representations; the specific site analysis for the proposed location. Lower Bank Risk
Personal equity — the mandatory owner contribution — virtually all hospitality lenders require the owner to contribute a minimum of 20–30% of total project cost from personal equity. This “skin in the game” requirement demonstrates commitment and reduces lender risk. The business plan’s startup cost schedule must show the total project cost and identify: how much is from CSBFP or bank financing; how much is from personal savings, RRSP withdrawal (Home Buyers Plan analogy), or family gifts/loans; how much is from investor equity. Insufficient personal equity is the most common reason CSBFP and bank financing applications are declined for first-time hospitality operators. 20–30% Required

9. Hospitality Financial Benchmarks Canada 2026

MetricRestaurantHotelBar/NightclubCPA Interpretation
Food/Beverage Cost %28–35% food28–35% F&B18–25% pour costAbove benchmark: over-portioning, theft, waste, menu pricing too low; below: potential quality perception issue; model based on actual menu costing
Labour Cost %28–38%25–35%22–30%Rising labour cost % (Ontario, BC minimum wage increases) is the greatest pressure on Canadian hospitality margins 2024–2026; automation and menu simplification are key mitigation strategies
Prime Cost (food + labour)55–65%N/A (rooms dept: 25–30%)40–55%Primary restaurant financial health indicator; above 65% = financial distress; business plan must demonstrate how the specific concept achieves the prime cost target
EBITDA Margin8–18%25–40%12–22%Hotel EBITDA margins are typically higher due to leverage (once occupancy covers fixed costs, each additional room night is highly profitable); below 8% for restaurants = not financially sustainable
Occupancy Rate (hotel)N/A60–80% (stabilized)N/ABelow 60% occupancy at stabilized rate signals either demand shortfall or supply excess; hotel business plan must model ramp-up period before projecting stabilized occupancy
Revenue per Seat per Year$3,000–$8,000N/AN/AHigh revenue per seat signals efficient table turns and AOV; a 50-seat restaurant projecting $200,000 annual revenue = $4,000/seat; low for a casual dining model — target $5,000–$7,000 for financial sustainability

10. Hospitality Business Plan — Lender-Ready Checklist

✓ CSBFP and Bank Financing — Hospitality Business Plan Checklist
🍽️ Detailed startup cost schedule — every dollar of the project cost broken down: equipment list with quoted prices; leasehold improvement scope and contractor quotes; working capital (3–6 months of operating expenses); pre-opening costs (training, permits, staff recruitment, marketing); contingency (10–15% of construction costs). Sources of funds matching the uses exactly. The startup cost schedule is the foundation of the CSBFP application. Most Critical
📋 36-month monthly financial projections — income statement (revenue by category; food/beverage cost; labour cost by department; occupancy; utilities; marketing; EBITDA); cash flow statement (monthly cash in/out including loan repayments, tax remittances, and owner draws); balance sheet at fiscal year-end. Projections must be built from specific assumptions (daily cover count × AOV for restaurants; daily room count × ADR for hotels) — not rounded top-down estimates. Monthly Required
📈 Break-even analysis — the daily/weekly revenue needed to cover all fixed and variable costs. For a restaurant: Break-even Revenue = Fixed Costs ÷ (1 – Variable Cost %). At 62% prime cost + 8% occupancy + 5% utilities = 75% variable/semi-variable: break-even = Fixed G&A ÷ 25% contribution margin. Expressed as daily covers required × target AOV = daily break-even revenue. Lenders evaluate whether the projected cover count to achieve break-even is realistic given the location and seating capacity. Cover-Based Breakeven
🖊️ Owner resume and industry experience documentation — the lender’s most important non-financial evaluation: does this management team have the experience to operate this hospitality business? Include: years of relevant management experience; prior hospitality businesses owned or managed; culinary qualifications; formal business management training; specific references from prior employers or business partners. For first-time operators: identify a key hire with experience; or choose a franchise system that includes training and ongoing support. Experience Matters
📄 Signed lease or letter of intent from the landlord — a CSBFP application for leasehold improvements requires evidence of the lease. At minimum: a letter of intent (LOI) signed by the landlord specifying: rent amount; lease term and renewal options; leasehold improvement allowance; exclusivity provisions; assignment rights. Lenders will not advance leasehold improvement funds unless the lease term exceeds the loan amortization period. A 5-year CSBFP loan requires a lease with at least 5 years remaining plus renewal options. Lease Before Loan
Custom CPA’s Hospitality Business Plan Service: Custom CPA prepares professional business plans for Canadian hospitality businesses — restaurant financial models with food and labour cost analysis, hotel RevPAR and GOPPAR projections, bar and nightclub pour cost models, catering event financial models, CSBFP financing packages, startup cost schedules, 36-month financial projections, and lender-ready presentation formats. Our Business Planning & Financial Modeling service produces hospitality business plans that Canadian banks approve. Our Core Accounting & Tax Services provide ongoing hospitality bookkeeping and tax compliance after opening. And our Strategic CFO Advisory Services provide the ongoing financial management that keeps hospitality businesses profitable through their most critical growth years.

✓ Custom CPA — Hospitality Business Plans Built for Canadian Lenders and Investors

Restaurant food cost models, hotel RevPAR projections, bar pour cost analysis, CSBFP packages, startup cost schedules, 36-month financial projections, and break-even analysis — the complete CPA business plan service for every type of Canadian hospitality business.

11. Frequently Asked Questions

What should a restaurant business plan include in Canada?
A Canadian restaurant business plan must address both the concept’s market viability and its financial sustainability. Here is the comprehensive guide: Section 1: Executive Summary (2 pages — write this last): restaurant name and concept; location or target area; cuisine type and price point; seating capacity; target customer; 3-year financial summary (Year 1 revenue, Year 3 revenue, Year 3 EBITDA margin); funding request (amount, what it will be used for, CSBFP eligibility breakdown); owner’s experience in the hospitality industry. Section 2: Concept Description: cuisine style and philosophy; menu direction (include a sample menu or category descriptions with approximate price points); ambiance and design concept; hours of operation; seating capacity breakdown (dining room, patio, bar); takeout and delivery strategy; liquor service (full liquor, beer and wine only, no liquor); special features (private dining room, live music, chef’s table). Section 3: Market Analysis: trade area demographics (population, income, age); pedestrian/vehicle traffic at the location; competitive landscape (named competitors with their price point, estimated weekly covers, and their specific weaknesses you will address); why this location is right for this concept; market trends supporting the opportunity. Section 4: Operations Plan: kitchen layout and flow; key equipment list; staffing plan (FOH: host, servers, bartenders, bussers; BOH: head chef, sous chef, line cooks, dishwashers); POS system selection; supplier relationships; food safety program; reservation system; delivery and takeout strategy; hours and days of operation. Section 5: Management Team: owner and key management team bios; relevant industry experience; culinary credentials; business management background; any industry awards or recognition; references available on request. Section 6: Financial Plan (must be CPA-prepared for bank submission): Startup cost schedule: equipment list with quotes; leasehold improvement budget with contractor bids; furniture and fixtures; POS system; pre-opening (training, permits, marketing launch, staff recruitment); initial inventory; working capital reserve (3–6 months operating expenses); contingency (10–15%); total project cost and sources of funds. Revenue model: seating capacity; table turns per service (lunch and dinner separately); average check by service; covers per week by day; seasonal adjustment (January–February trough; summer patio peak). Food cost model: food cost % by category (kitchen, bar, bakery, seasonal); target blended food cost %; annual food cost dollar estimate. Labour model: staffing schedule by day part (open, lunch, dinner, close); hourly rates by position; full-time vs. part-time split; employer CPP/EI and WSIB/WCB. 36-month income statement (monthly for Year 1; quarterly for Year 2–3). Monthly cash flow projection. Break-even analysis: daily covers required × AOV to break even. GST/HST model: quarterly payable/refundable estimate. Sensitivity analysis: what if covers are 20% below projection? What if food costs rise 5%? Financing request: CSBFP equipment and leasehold amounts; bank interest rate and amortization; monthly payment; DSCR (should be ≥1.25x). Common mistakes that cause restaurant business plan rejection: (1) Generic industry average food and labour costs — the CPA must build from your actual menu prices and staffing plan; (2) Projecting full capacity immediately — model a 3–6 month ramp-up period; (3) Missing working capital — 3–6 months of operating expenses must be included; (4) No competitive analysis — banks want to see that the market is not already saturated; (5) Unrealistic prime cost — projecting 40% food cost and 20% labour cost in a tight labour market is not credible.
How much does it cost to open a restaurant in Canada?
Opening a restaurant in Canada in 2026 requires a comprehensive understanding of both the hard costs (equipment, leasehold improvements) and the soft costs (working capital, pre-opening expenses) that many first-time restaurateurs underestimate. Here is the complete cost framework: Quick Service Restaurant (QSR) / Fast Casual — existing commercial kitchen space: kitchen equipment: $30,000–$80,000 (used equipment reduces cost; new for franchise: $50,000–$120,000); leasehold improvements (counter, signage, HVAC upgrades): $20,000–$80,000; POS system (Lightspeed, Toast, Square): $3,000–$10,000; furniture and fixtures: $10,000–$25,000; pre-opening training and marketing: $5,000–$15,000; permits and licenses: $3,000–$8,000; initial inventory: $5,000–$10,000; working capital (3 months): $20,000–$40,000. Total: $100,000–$350,000. Casual Dining Restaurant (raw or previously retail space): full kitchen build-out (plumbing, gas, exhaust, HVAC, electrical): $80,000–$200,000; walk-in cooler and refrigeration: $20,000–$45,000; commercial kitchen equipment: $50,000–$120,000; dining room furniture and fixtures: $30,000–$80,000; bar construction (if licensed): $30,000–$80,000; branding, signage, website, launch marketing: $15,000–$40,000; permits, health inspection, business license: $5,000–$15,000; liquor license (provincial variation): Ontario: $500–$1,500 application (plus endorsements); BC: varies significantly by license type; Alberta: initial application fee; pre-opening costs (staff training, chef salary before opening): $15,000–$40,000; first and last month rent + security deposit: $15,000–$50,000; working capital reserve (4–6 months operating costs): $60,000–$150,000. Total: $350,000–$750,000. Fine Dining Restaurant: all casual dining costs PLUS: premium kitchen equipment (convection, combi-oven, sous vide, specialty equipment): additional $30,000–$80,000; custom millwork and premium design ($100,000–$400,000 for a true fine dining environment); wine cellar or wine display system: $15,000–$50,000; high-end dinnerware, glassware, linens: $15,000–$40,000; chef recruitment and relocation: $5,000–$25,000. Total: $600,000–$2,000,000+. The underestimated costs that kill restaurants before they open: (1) Working capital: the restaurant that opens with exactly enough money to finish the build-out but no reserves for the first 3 months of operation (when revenue is ramping up but all costs are running) is the restaurant that closes in Month 4. Standard guidance: have 4–6 months of operating expenses in reserve at opening. (2) Construction cost overruns: restaurant build-outs routinely run 15–25% over budget. Build a 15% contingency into your startup cost schedule. (3) Permit delays: health inspection, building permit, and liquor license delays can push the opening date 1–3 months and add significant carrying costs (rent paid on a location not yet generating revenue). (4) Pre-opening training: a well-run restaurant requires 2–4 weeks of staff training before opening. The labour cost during training (before revenue) is often underbudgeted. CSBFP financing for restaurant startup costs: the CSBFP is the primary financing tool for restaurant equipment and leasehold improvement costs. Eligible under CSBFP: all kitchen equipment (listed on the equipment schedule); bar equipment; POS hardware; leasehold improvements (HVAC, plumbing, electrical, wall finishes, flooring); furniture and fixtures. NOT eligible: liquor license; pre-opening training costs; working capital (partially eligible since 2022 expansion); inventory; owner salary.
What is a good profit margin for a restaurant in Canada?
Restaurant profit margins in Canada are notoriously narrow — the hospitality industry has among the lowest profit margins of any business sector. Understanding what a “good” margin looks like at each stage is essential for business planning. Here is the comprehensive guide: The Prime Cost Framework — the most important restaurant financial metric: Prime Cost = Food Cost % + Labour Cost %. For any Canadian restaurant concept, Prime Cost should not exceed 60–65% of revenue. The reason: the remaining 35–40% must cover: rent and occupancy (6–12% for most locations); utilities (3–6%); marketing and delivery platform commissions (3–7%); insurance (1–2%); accounting and administrative (1–2%); maintenance and supplies (1–2%); debt service (if financed). If prime cost is 65% and occupancy is 10%, only 25% remains for all other costs and EBITDA. That 25% is unlikely to cover the remaining operating costs AND generate meaningful profit for most concepts. EBITDA margin benchmarks by restaurant type: Quick Service Restaurant (Tim Hortons, McDonald’s style): EBITDA 15–25%; benefiting from lower labour (automation, simplified menu) and lower food cost (commodity ingredients). Fast Casual (Chipotle, Freshii style): EBITDA 12–20%; generally lower labour than full-service; moderate food cost. Casual Dining (Earls, The Keg, Boston Pizza style): EBITDA 8–15%; full service with more complex menu; higher labour; higher food cost. Fine Dining: EBITDA 5–12%; the most challenging margin structure with highest food cost (premium ingredients), highest labour cost (skilled kitchen and service staff), and highest occupancy cost (premium locations). Chef-owned/independent: EBITDA varies widely but typically 5–15%; higher variability due to inconsistent traffic and operational inconsistency. Food Truck: EBITDA 15–30%; low occupancy cost, low capital; higher margin but limited revenue ceiling. Catering: EBITDA 15–25%; efficient production, no wasted covers; event-based revenue with lower fixed costs. Why Canadian restaurant margins are under particular pressure in 2026: minimum wage increases: Ontario $17.20/hour; BC $17.40/hour; Alberta $15/hour — each $1 increase in minimum wage directly increases labour costs by approximately 2–3% of revenue for labour-intensive formats; food inflation: food costs in Canada have increased 15–25% since 2021 for many key ingredients; commercial real estate: restaurant rent in urban centres has increased significantly; third-party delivery commissions: DoorDash, Uber Eats, and SkipTheDishes charge 15–30% of delivery order value — delivery orders at 25% commission with 30% food cost and 30% labour = 85% of revenue consumed before overhead. What a “good” margin looks like for a business plan: for a bank financing application: Year 3 EBITDA margin of 10%+ for a casual dining restaurant is considered acceptable; 15%+ is strong; below 8% at Year 3 will typically not support the debt service requirements. For an investor: EBITDA margin is important, but investor-focused business plans also address cash-on-cash return and exit strategy (franchising the concept, selling the business, or opening additional locations).
What financing is available for a Canadian hospitality business?
Canadian hospitality businesses have access to a specific set of financing tools that address the industry’s capital-intensive nature. Here is the comprehensive guide: 1. Canada Small Business Financing Program (CSBFP) — the cornerstone of Canadian restaurant financing: the CSBFP is a federal government program that allows chartered banks to lend to small businesses with an 85% government guarantee on the loan. For hospitality businesses: Equipment loans (up to $1,000,000): covers all commercial kitchen equipment; bar equipment; POS hardware; hotel FF&E; food truck; catering equipment. Leasehold improvement loans (up to $1,000,000): covers restaurant build-out; kitchen plumbing, electrical, and HVAC; bar construction; hotel room renovation; signage and accessibility improvements. Working capital (up to $500,000 since 2022 expansion): covers first-year operating costs; marketing; staff training; initial inventory. The maximum combined CSBFP exposure for a single borrower across all loans is $1.5M. Interest rate: equipment and leasehold: maximum prime + 3% (currently approximately 8.75–9.25%); working capital: maximum prime + 5%. Terms: equipment: up to 10 years; leasehold: up to the lesser of 15 years or the remaining lease term; working capital: up to 5 years. Personal guarantee: required from all owners with 10%+ ownership. Business plan requirement: a formal business plan with 3-year financial projections is required. The CSBFP application is submitted through any participating Canadian chartered bank — the government does not lend directly. The hospitality operator applies at their bank, the bank approves the loan under CSBFP criteria, and the government provides the guarantee. 2. BDC (Business Development Bank of Canada) — flexible hospitality financing: BDC specifically supports tourism and hospitality businesses across Canada and is often more flexible than chartered banks for: first-time operators without prior business ownership history; businesses in smaller markets or rural areas; operators with strong concepts but limited collateral. BDC products for hospitality: start-up loans ($25,000–$500,000); working capital loans; equipment financing; seasonal business financing (advance working capital before summer season; repay from peak revenue). BDC hospitality application: business plan required; financial projections; management experience documentation. BDC is often the right choice when the chartered bank declines or is uncomfortable with the specific hospitality concept. 3. Franchise financing — the preferred path for major lenders: established Canadian franchise brands (Tim Hortons, Subway, Boston Pizza, A&W, etc.) have pre-negotiated financing relationships with major Canadian banks. Benefits: the bank uses the franchise system’s financial performance data rather than requiring independent market analysis; the franchisor’s training and support reduces the lender’s risk; some franchise systems have preferred lender programs with better rates or terms. Application requirement: FDD (Franchise Disclosure Document); site location analysis; personal financial statement; business plan (the franchisor often provides a template). 4. Provincial tourism and hospitality grants/loans: several Canadian provinces have specific tourism development programs: Saskatchewan: Saskatchewan Tourism Loan Fund; BC: various tourism development programs; Alberta: Tourism Levy grants and regional development; Ontario: Regional Economic Development programs. These programs often have lower interest rates or non-repayable grant components. The business plan must explicitly address the tourism or regional economic development impact to qualify. 5. Bank commercial mortgage for owned hospitality properties: for hospitality businesses that are purchasing (not leasing) their property: commercial mortgage at 65–75% LTV; 5–10 year terms with amortization up to 25 years; requires business plan, property appraisal, environmental assessment; personal guarantee required. Many successful restaurateurs build long-term wealth by owning their building — the commercial mortgage enables this. 6. Personal equity — non-negotiable for hospitality financing: virtually all hospitality lenders require a minimum of 20–30% of total project cost from the owner’s personal resources. Sources: personal savings; RRSP withdrawal under the First Home Buyers Plan analogy (consult a CPA — RRSP withdrawal for business is taxable, unlike HBP); family gifts or loans; proceeds from personal asset sales. Insufficient personal equity is the single most common reason hospitality financing applications fail. Budget for a minimum of $50,000–$150,000 in personal equity for most restaurant concepts, and more for larger or more ambitious projects.
How do I write a hotel business plan in Canada?
A hotel business plan in Canada requires specialized financial modeling that differs significantly from a restaurant or retail business plan. Here is the comprehensive guide: Section 1: Property Description: property address and location; number and type of rooms (standard king, queen, accessible, suite, studio); total available rooms (AR = total rooms × 365 days); amenities (pool, fitness center, business center, on-site F&B, meeting rooms, parking); property condition (new build, major renovation, or existing operating hotel acquisition); brand affiliation (flag vs. independent). Section 2: Market Analysis — hotel-specific: demand segmentation: corporate transient (business travelers); leisure transient; group (meetings, conferences, events); government; extended stay. Demand generators in the specific market: corporate accounts (identify major employers in the area); tourism attractions (parks, casinos, sports venues, convention centers); proximity to major transportation (airport, highway interchange); year-round vs. seasonal demand. Competitive set analysis using STR data (if available): the STR (formerly Smith Travel Research) provides aggregated ADR, occupancy, and RevPAR for defined competitive sets; this is the gold-standard hospitality market data used by lenders and brands. If STR data is not accessible: conduct a manual competitive survey of comparable hotels, their posted rates, and estimated occupancy through booking channels. Section 3: Financial Model — hotel-specific metrics: ADR projection: project ADR by month (reflecting seasonal variation); benchmark against competitive set ADR; identify any specific advantages that justify above-market ADR (unique location, superior amenities, brand premium). Occupancy projection: ramp-up period (Months 1–6: 35–55% occupancy; Months 7–18: 60–70% occupancy; stabilized at 65–80% depending on market). RevPAR = ADR × Occupancy %; project monthly and annually. Rooms revenue = RevPAR × Total Available Rooms. F&B revenue: restaurant and bar revenue per occupied room per day; banquet and meeting revenue; room service; catering. Other revenue: parking (if a fee); telephone and internet; retail; laundry. Total revenue by department. Departmental expenses: rooms department (housekeeping, front desk, amenity costs): typically 25–35% of rooms revenue; F&B department expenses: 55–75% of F&B revenue (lower than standalone restaurant due to hotel captive audience benefits). Undistributed expenses: A&G (administration + general): 7–10% of total revenue; sales and marketing: 4–8%; property maintenance: 5–8%; utilities: 4–7%. Fixed charges: property taxes; insurance; management fee (if using a hotel management company: 2–4% of revenue + incentive fee); franchise royalty fee (if branded: 4–8% of rooms revenue); FF&E reserve (capital replacement fund: typically 3–5% of rooms revenue). EBITDA after all operating costs but before debt service. Debt service: proposed mortgage payment; DSCR = EBITDA ÷ Annual Debt Service ≥1.25x. Section 4: Financing Structure for Hotels: typical hotel financing stack: equity (25–35% of total project cost); first mortgage (55–65% of appraised value); CMHC insured financing (available for qualifying purpose-built rental and hospitality properties; competitive rates; requires 15–25% equity); CSBFP for equipment portion (up to $1M for hotel FF&E and specific leasehold); mezzanine or bridge financing if gaps exist between equity, first mortgage, and total project cost. Hotel valuation methods: income capitalization (NOI ÷ Cap Rate = Value); comparable sales; replacement cost. Lender appraisals will assess hotel value on all three methods. Common hotel business plan mistakes: (1) Using a cap rate that is too low (inflates projected value artificially); confirm cap rates with the bank’s appraiser for the specific market; (2) Not modeling the ramp-up period — projecting 75% occupancy from Month 1 is not credible; (3) Missing the pre-opening and working capital costs — hotel pre-opening costs (staff training, marketing launch, distribution system setup) are significant; (4) Not addressing OTA (Online Travel Agency) commission cost — Booking.com and Expedia charge 15–20% on their bookings; the cost must be in the financial model.
Disclaimer: The above contents are provided for general guidance only, based on information believed to be accurate and complete, but we cannot guarantee its accuracy or completeness. It does not provide legal advice, nor can it or should it be relied upon. Please contact/consult a qualified tax professional specific to your case.
Scroll to Top